Data reports in Case Manager are comprised of three distinct parts that are all necessary for bringing it together. These components are the Parameters, Queries and Tables.
What are Parameters?
Parameters are external values that can be manually entered by a caseworker prior to generating a report. These values will restrict the data output by the report to allow for more relevant figures to be provided to them.
The most common parameters used in reporting will be date ranges. These will allow users to select a pair of dates and filter the report's results to be inbetween them; the date that this is based on will depend on the type of data that the report is working with. Common examples include the Case Open Date and the Case Action Date.
Parameters can be added to an advanced report by completing two steps. The first is to add the parameters to the top of the report. For this example, we will be adding two date parameters to the report called startDate and endDate.
Parameters are made up of three parts; the ID, the Name, and the Value. The ID is the internal name for the parameter that we reference when we want to use the parameter in the code. The name is the display value of the parameter that we use when showing the parameters visually. The value is the content that we supply to the parameter, which we will elaborate on shortly.
The second step will not take place until the very end of the report writing process. After creating the report and adding it to your system, all of the parameters that were added will need to have values supplied to them to be able to restrict the report's output. To do this, we need to add Fields to the report. This can be done by selecting the Add a field option from the Report Tasks area.
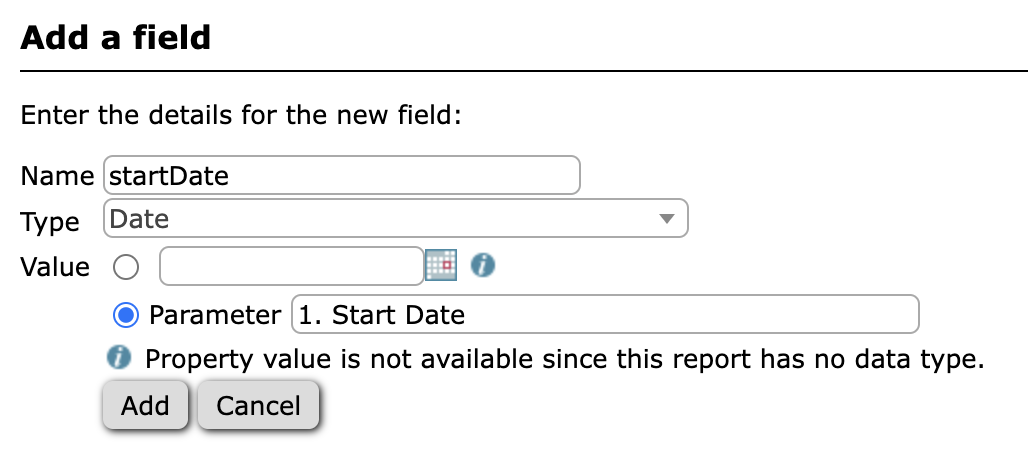
Fields need to be provided with a name, which matches the value assigned in the report's code. They also require a type, which refers to the kind of data that the field can take in, and a value, which refers to the data supplied to this field. This can either be a pre-determined value, or we can select the Parameter option and supply it with a display name, which will allow users to enter a value of their choice.
In the example above, we are creating a new date field called startDate that is set up as a parameter, so users can enter any date value they want into it.
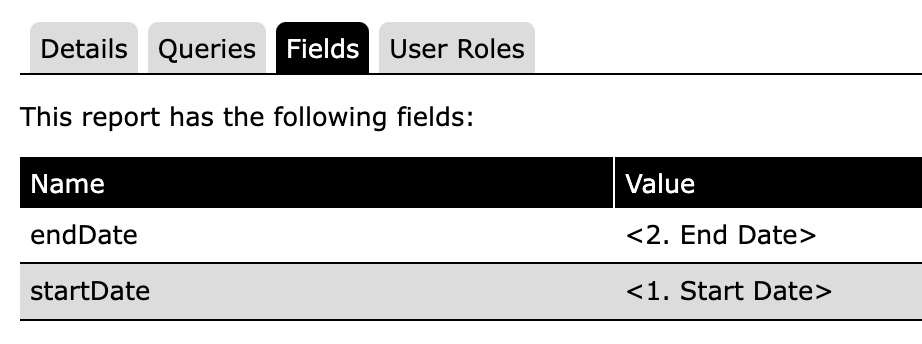
Fields can be viewed under the Fields area on the report. If the name of the field in Case Manager matches with the value on the parameter in the report's code, the parameters will be connected and the report can now make use of it in its filtering.
What are Queries?
Queries are the bulk of an advanced report. These are used to directly search through your system and collect the data for the report by navigating through the Data Structure of the system. They are written in Hibernate Query Language (HQL) and use queries very similar to those used for searching through databases; if you're familiar with Structured Query Language (SQL), you will already be very familiar with the formatting of these queries.
A query is composed of five parts, two of which are optional.
SELECT
This part is used to highlight the data that we are looking for. The data that is brought out by the query will be written out here such as reference numbers, timestamps and client or case details such as the client's address or the case's type.
FROM
This part is used to build a path towards the data we have asked for in the SELECT section. A starting point for where the data will be called from is chosen such as the Case record or the Client record, which will then create a web of different paths to different properties on that data type through JOIN statements. This allows the query to expand beyond the fields directly at that starting point and provide more relevant data for the report output.
JOINs can only connect to one data point at a time, so for each jump you want to make, a separate JOIN has to be made. Each JOIN is given its own name, so we can reference fields connected to that point in the SELECT section.
It is worth noting that by default, JOINs are mandatory connections. If there is data that a report needs which is not always going to be there such as the closing date on a case, then LEFT JOIN statements can be used instead to indicate an optional path.
WHERE
This part is used to filter the data pulled out by the query based on the report's purpose. Parameters that will restrict the report's output such as a date range can be specified here, as well as hard-coded restrictions like limiting the report to only gather cases of a specific case type.
GROUP BY (Optional)
This part is used to collate data together based on specific data fields in the report. It is often used for collecting similar pieces of data together to allow for useable figures to be calculated and presented in the output. For example, you may group together cases based on their case type so that you can see how many cases of each type were created in your system over a specified date range.
ORDER BY (Optional)
This part is used to determine the order in which data is presented in the report. It only works off of an ascending or descending pattern, but it can be used to make data more readable. A common application would be to order the data by a date field in descending order so that it will show the most recent data first.
Example Report
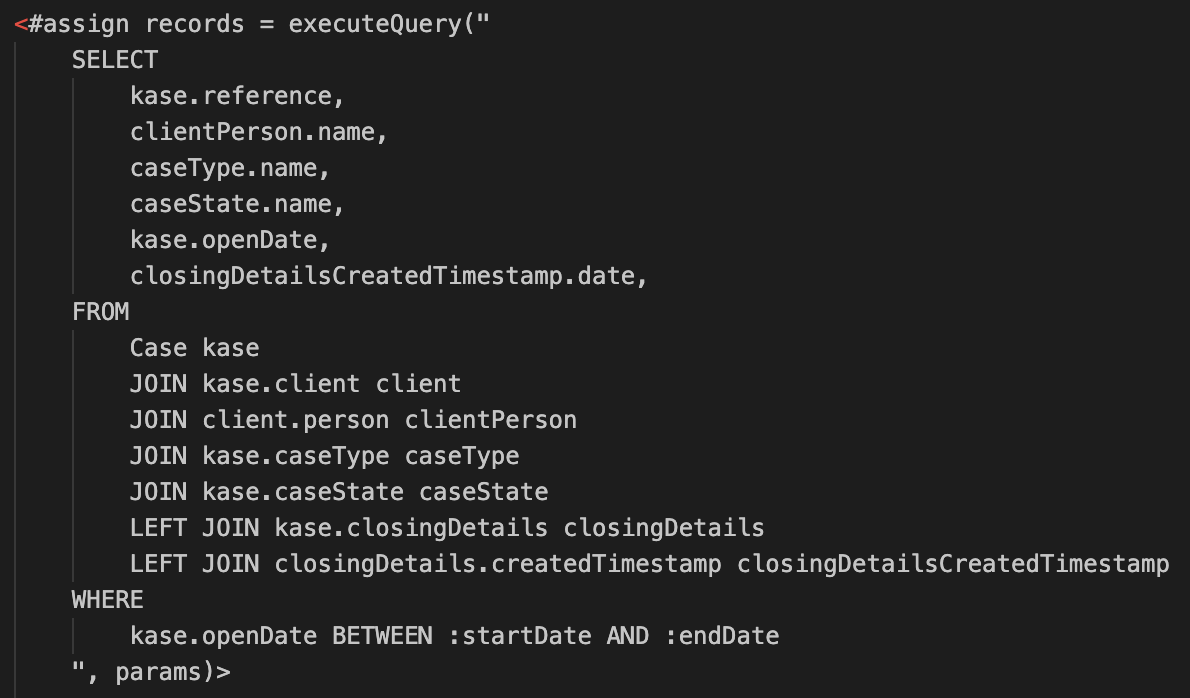
In this example, we are trying to get data from all cases that were opened over a specific time period. We want to know some basic information about each case such as the name of the client and the date it was opened.
Let's start with the FROM section. In here, we have decided that we are getting data from the case level, so we start by defining the root of the report; in this instance, Case. We have thought about the fields that we want in the report and have decided on the following:
- The reference for the case
- The client's name
- The type of the case
- The case's current state
- When the case was opened
- If the case was closed, when.
To get this data, we have made a series of JOINs through the properties of the case to reach the ones that we cannot already get from being on the case already. The case's open date is already found on the case, so we don't need to make any JOINs to get that and can call it directly from the case. Other data such as the client is found on its own entity that is separate from the case, so we need to join from the case to the client to be able to get data that is on the client.
If you want to know which fields are available at the report's starting point, as well as how to get to those fields, please refer to this guide about Data Types.
(INSERT LINK TO NEW ARTICLE HERE)
With the FROM section sorted, we can then write the SELECT section using the paths we have created, pulling data from the different JOINs as and when required.
Finally, we can set up the date range restrictions on the report by adding a check to the WHERE section based on the case's open date and the two parameters we set up for the report previously. Parameters are referenced in queries by the colon (:) symbol placed before the id, as seen in the example above as :startDate and :endDate.
What are Tables?
Tables are the forward facing aspect of the report that will display the data gathered by the queries and restricted by the parameters to the caseworker. These are written using the Hyper Text Markup Language (HTML) alongside a set of custom systems we have made called macros. These macros are pre-written pieces of code that can be called to generate content for you, which in this case is the tables we are outputting the queries into. The HTML code support means that any users who have experience with the programming language will be able to format and style the output of the report to suit their needs, but please note that most of this will only be supported when generating the report as a HTML output file, rather than as an Excel CSV file.
For the purposes of this document, we will only be covering the usage of the table macros for outputting data. For more information on how HTML is supported by Case Manager reports, please refer to the following documentation:
(INSERT LINK TO NEW ARTICLE HERE)
Example Table
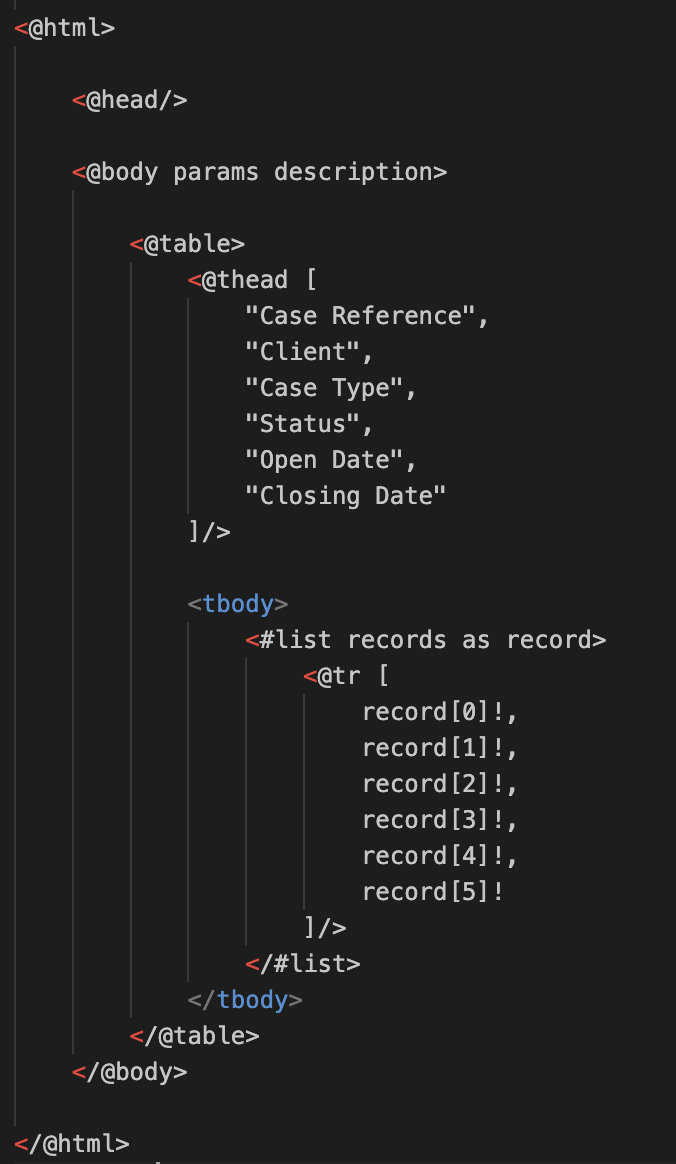
In this example, we are using macros to create a simple table comprised of six columns for each of the pieces of data we are calling in our query. The thead, meaning "Table Head", macro defines the column names that appear at the top of the report. The tr or "Table Row" macro defines the content of each row that appears in the table.
To output the contents of the report, we make use of a list, which is a property that goes through the query, which in this case we are storing as a variable called records, and outputs each result that the query brings back one at a time. By setting a secondary name that we can use to represent each individual record being output, conveniently named record in this instance, we can manually bring out every value from this record and use them to populate each column of the report.
Note: You may have noticed that the contents of the list are output numerically, and that these numbers start at 0 rather than one. This is because lists hold the data for each column in an array, which is a way of holding multiple pieces of data in one place. These arrays are zero-based; each item in the array is assigned an index number that can be called to get out that specific item, and this set of indexes starts with 0 instead of 1.


Alex Bird
Comments